News
SilverCrest Announces Results of Updated Independent Technical Report
VANCOUVER, BC – July 31, 2023 – SilverCrest Metals Inc. (“SilverCrest” or the “Company”) is pleased to announce the results from an Updated Independent Technical Report (the “Report”) for the Las Chispas Operation (“Las Chispas” or the “Operation”) in Sonora, Mexico prepared by Ausenco Engineering Canada Inc. (“Ausenco”) with the assistance of several other independent engineering companies and consultants. The Report will be filed on SEDAR+ within 45 days of the date of this news release. All amounts herein are presented in United States Dollars (“US$”), unless otherwise stated.
The effective date of the Measured and Indicated (“M&I”) Mineral Resource and Mineral Reserve Estimate is June 30, 2022. The financial model and Life of Mine (“LOM”) production plan, factoring in the processed and depleted ore up to December 31, 2022, starts on January 1, 2023. The results announced in this news release are compared to those disclosed in a prior technical report dated January 4, 2021 (the “2021 Feasibility Study” or “2021 FS”) filed on SEDAR February 2, 2021 titled “NI 43-101 Technical Report & Feasibility Study on The Las Chispas Project”. In this Report, silver equivalent (“AgEq”) references are based on an updated silver (“Ag”) to gold (“Au”) ratio of 79.51:1 (formerly 86.9:1 in the 2021 FS). The 2021 Feasibility Study is no longer current, the 2021 Feasibility Study results are no longer supported by the results in the Report and should not be relied upon.
Updated Technical Report Highlights
- Robust Production Profile with Strong NPV of $549.9M at Base Case - The Report has confirmed strong economics for an eight-year operation generating average annual production of 57 thousand (“k”) ounces (“oz”)/year Au and 5.5 million (“M”) oz/year Ag (10.0 Moz/year AgEq) during the first seven full years. Using a 5% discount rate and average gold and silver prices of $1,800/oz and $23.00/oz respectively as the Base Case, Las Chispas generates a post-tax net present value (“NPV (5%)”) of $549.9M.
- Strong Cash Flows, Debt Free, Healthy Balance Sheet - The Operation is estimated to generate average annual post-tax free cash flow of approximately $84.3M from 2023 to 2029 at the Base Case. SilverCrest has paid off 100% of its $90M debt since commercial production was announced in November 2022 and at the end of Q2, 2023 had accumulated a treasury assets1 balance of $59.0M.
- Report Details Supported by Current Operational Performance - The Report is based on actual operating data from the mine and process plant, including cost models supported by actual operating costs, completion of more than 16 kilometres (“km”) of underground development (January 2021 to December 2022) and recovered metal of 17.8 koz Au and 1.74 Moz Ag (3.2 Moz AgEq) since process plant startup in early June 2022 until the end of 2022.
- Updated Mineral Reserve Estimate - The updated Proven and Probable Mineral Reserve Estimate of 78.6 Moz AgEq (3.4 Mt grading 4.08 gpt Au and 395 gpt Ag, or 719 gpt AgEq) is a 13% reduction in AgEg ounces from the 2021 FS. This reduction incorporates the updated gold to silver ratio, updated modelling for narrower and more widely dispersed veins than originally modelled, increase in cut-off grades due to increased industry costs, revised geotechnical standards, and mining method changes.
- Simplified Underground Production Plan - The updated production plan reaches slightly above 1,200 tonnes per day (“tpd”) in 2026 and is largely supported by long-hole stoping (77%) with the balance being cut and fill (17%), and resue (6%). This approach significantly simplifies the mine plan through the reduction of working faces, equipment and labour, while also addressing safety and productivity issues. The use of this bulk mining method, when combined with narrower veins, has led to a reduction in LOM mined grade of approximately 18%.
- Metallurgical Recoveries Improved - The Report is based on actual achieved process plant metallurgical recoveries of an estimated 98.0% Au and 97.0% Ag, both improved from the recoveries of 97.6% Au and 94.3% Ag estimated in the 2021 FS.
- Higher Sustaining Capital Reflects Increased Costs and Expanded Mine Footprint - LOM sustaining capital of $219.9M has increased by 77.5% compared to the 2021 FS as development unit costs and the amount of infrastructure required increased due to the expanded mine footprint.
- Lowest Quartile2 AISC Remains - The Report estimates all-in sustaining costs3 (“AISC”) to average $11.98/AgEq payable oz over the LOM, exclusive of corporate level G&A and sustaining exploration costs. For the period of H2, 2023 through 2024, the AISC is estimated to average approximately $13.50/AgEq payable oz which is the highest cost period in the LOM due to an accelerated spend in sustaining capital to support ramp-up of mine throughput.
- Immediate and Longer-Term Growth Opportunities - Immediate growth will be targeted through a $10M exploration program focused on targeting 40% of the updated Inferred Mineral Resource (1.3 Mt grading 566 gpt AgEq or 24.1 Moz AgEq) for conversion to M&I Mineral Resources for future Mineral Reserve consideration. The focus is on higher grade Mineral Reserve replacement targets proximal to current and planned infrastructure. Earlier stage exploration opportunities at Las Chispas will be pursued in parallel.
1 Treasury assets is a Non-IFRS measure. See “Non-IFRS Measures” section below. At the end of Q2, 2023, treasury assets include cash of $53.4M and bullion purchases held at current market value of $5.6M.
2 Source: Company Reports, S&P Global Market Intelligence, FactSet, Analyst Estimates.
3 AISC is a Non-IFRS measure. See “Non-IFRS Measures” section below.
Pierre Beaudoin, COO, commented, “The results from the Report confirm our confidence in Las Chispas, which has also been demonstrated through strong operational performance since commissioning was undertaken in Q2, 2022. The Report reflects updated costs and production expectations, and although these have changed since the 2021 Feasibility Study, we view them to be executable, particularly as they are supported by recent operating experience. We thank our operations team and numerous independent consultants who advanced this work, while also simultaneously executing at the Las Chispas Operation.”
N. Eric Fier, CEO stated “The release of the results from the Report is a significant milestone and the latest of a long list of de-risking events for our Company. Given the current worldwide inflationary environment and site-specific changes, our updated Mineral Resources and Reserves, production and costing estimates better reflect the current operating parameters at Las Chispas. The operational performance and cash flow generated to date at Las Chispas support the findings of the Report which outline a high margin operation that generates significant free cash flow. The recent success of the Operation has allowed us to repay all $90M of debt since commercial production was achieved in November of 2022, while also building a strong treasury assets balance of $59.0M at the end of Q2, 2023. We look forward to releasing full details of our Q2, 2023 operational and financial performance next week. We are very encouraged to now be able to refocus the Company’s human and financial resources to the next phase of growth and responsible capital allocation.“
Table 1 – Updated Technical Report Overview
| Las Chispas Updated Technical Report Summary as of Jan. 1, 2023 | |
| Average Process Plant Throughput (2023 to 2029) (tpd) | 1,200 |
| Mine Life (years) | 8.0 |
| Average Gold Process Plant Head Grade (gpt Au) | 4.02 |
| Average Silver Process Plant Head Grade (gpt Ag) | 396.1 |
| Average Silver Equivalent Process Plant Head Grade (gpt AgEq) | 716.1 |
| Contained Gold in Mine Plan (koz Au) | 422.7 |
| Contained Silver in Mine Plan (koz Ag) | 41,615.5 |
| Contained Silver Equivalent in Mine Plan (koz AgEq) | 75,227.5 |
| Average Gold Metallurgical Recovery (% Au) | 98.0 |
| Average Silver Metallurgical Recovery (% Ag) | 97.0 |
| Payable Gold (koz Au) | 421.6 |
| Payable Silver (koz Ag) | 41,005.5 |
| Payable Silver Equivalent (koz AgEq) | 74,525.4 |
| Average Annual Production (2023 to 2029) | |
| Gold (Au koz/yr) | 57.0 |
| Silver (Ag koz/yr) | 5,503.5 |
| Silver Equivalent (AgEq koz/yr) | 10,036.0 |
| Mining Cost ($/t mined) | 108 |
| Process Cost ($/t processed) | 47 |
| G&A Cost ($/t processed) | 21 |
| Total Operating Cost ($/t processed) | 168 |
| LOM Sustaining Capital Cost ($M) | 219.9 |
| Closure Costs ($M) (2030 to 2032) | 6.8 |
| Cash Costs (1) ($/oz AgEq – Payable) LOM | 7.84 |
| AISC (1) ($/oz AgEq – Payable) LOM – Mine Level | 11.98 |
| Au Price ($/oz) | 1,800 |
| Ag Price ($/oz) | 23.00 |
| Pre-Tax NPV (5%, $M) | 706.5 |
| Post-Tax NPV (5%, $M) | 549.9 |
| Undiscounted LOM net free cash flow(1) ($M) | 654.1 |
| LOM AISC Margin (%) | 48% |
Notes:
- Cash costs, AISC and net free cash flows are Non-IFRS measures. See “Non-IFRS Measures” section below.
- All numbers in table pertain to full LOM (2023-2030) unless otherwise stated. Numbers are rounded.
- Reserve depleted by 3.4 Moz AgEq representing ore processed from July 1, 2022 to December 31, 2022.
- Payable metal includes ounces sold from inventory.
- Mine Level AISC does not include Corporate Level G&A, share-based compensation or exploration.
Mineral Resource Estimate
The Updated Mineral Resource Estimate is provided in Table 2. This estimate was completed for underground mining of in-situ vein deposits at the Babicanora and Las Chispas Areas and for surface extraction of stockpiles from historical and current operations. All drilling, surveying and assay databases were provided by SilverCrest including data up to the cut-off date of June 30, 2022 for M&I Resource Estimates and March 21, 2023 for the Inferred Mineral Resource Estimate.
The Updated Mineral Resource Estimate benefited from the improved understanding of the deposit gained through SilverCrest’s 18 months of development and production mining. Incorporating this knowledge and data led to several key changes in the Company’s approach to Mineral Resource modelling as discussed below.
The Mineral Resource Estimate model was updated to reflect: narrower veins located over a larger area, thus requiring increased underground development, increased constraints on geologic, statistical, and geostatistical modelling parameters resulting in reductions in resources mainly in Babicanora Main and Babicanora Norte Main veins and increased resources in the Babi Vista Vein, including the Babi Vista Splay. Additionally, there is an increase in the number of Mineral Resource veins and the veins are more widely dispersed. The Updated Inferred Mineral Resource Estimate is reduced from the 2021 FS due to conversion to M&I Mineral Resources and application of the same stricter constraints as applied to M&I Mineral Resources.
Table 2 – Mineral Resource Estimate
| Area | Classification | Tonnes (k) |
Au (gpt) |
Ag (gpt) |
AgEq (gpt) |
Contained Au (koz) |
Contained Ag (koz) |
Contained AgEq (koz) |
| Babicanora Area Veins | Measured | 206.6 | 13.67 | 1,289 | 2,376 | 90.8 | 8,561 | 15,779 |
| Indicated | 1,726.3 | 7.09 | 658 | 1,222 | 393.6 | 36,540 | 67,832 | |
| M&I | 1,932.9 | 7.79 | 726 | 1,345 | 484.3 | 45,101 | 83,611 | |
| Las Chispas Area Veins | Indicated | 441.6 | 4.22 | 552 | 888 | 60.0 | 7,835 | 12,605 |
| Total Undiluted Veins | M&I | 2,374.5 | 7.13 | 693 | 1,260 | 544.3 | 52,936 | 96,216 |
| Historical Stockpiles | Indicated | 151.8 | 1.14 | 112 | 203 | 5.6 | 546 | 990 |
| Run of Mine (“ROM”) Stockpiles | Measured | 168.1 | 5.56 | 428 | 869 | 30.0 | 2,311 | 4,699 |
| Total (Veins + stockpiles) | M&I | 2,694.4 | 6.69 | 644 | 1,176 | 579.9 | 55,794 | 101,905 |
| Babicanora Area Veins | Inferred | 953.5 | 4.49 | 267 | 624 | 137.5 | 8,188 | 19,123 |
| Las Chispas Area Veins | Inferred | 373.6 | 1.81 | 274 | 418 | 21.7 | 3,296 | 5,024 |
| Total Undiluted Veins | Inferred | 1,327.1 | 3.73 | 269 | 566 | 159.2 | 11,484 | 24,147 |
Notes:
- The effective date for M&I Resource estimates of the veins and stockpiles was June 30, 2022, while Inferred Resource estimates for the veins was effective March 21, 2023.
- Mineral Resources are not Mineral Reserves and do not have demonstrated economic viability.
- The estimate of Mineral Resources may be materially affected by environmental, permitting, legal, title, taxation, socio-political, marketing, or other relevant issues.
- The Inferred Mineral Resource in this estimate has a lower level of confidence than that applied to an Indicated Mineral Resource and must not be converted to a Mineral Reserve. It can be reasonably expected that the majority of the Inferred Mineral Resource could be upgraded to an Indicated Mineral Resource with continued exploration.
- Mined areas as of June 30, 2022, were removed from the wireframes and block models.
- AgEq is based on Ag:Au ratio of 79.51:1 calculated using $1,650/oz Au and $21/oz Ag, with average metallurgical recoveries of 97.9% Au and 96.7% Ag, and 99.9% payable for both Au and Ag.
- Mineral Resources are inclusive of the Mineral Reserves.
- Cut-off grade (“COG”) used for vein material is 150 gpt AgEq and, for Historical stockpiles is 110 gpt AgEq. No cut-off grade was applied to the ROM stockpile as it is based on material mined.
- Totals may not add due to rounding.
Mineral Reserve Estimate
The Mineral Reserve Estimate is provided in Table 3. The estimate was completed for underground mining of in-situ vein deposits at the Babicanora and Las Chispas Areas and for surface extraction of stockpiles from historical and current operations. All drilling, surveying and assay databases were provided by SilverCrest, including data up to the cut-off date of June 30, 2022 for Measured and Indicated Mineral Resources.
Table 3 – Proven and Probable Mineral Reserve Estimate
| Area | Tonnes (k) |
Au (gpt) |
Ag (gpt) |
AgEq (gpt) |
Contained Au (koz) |
Contained Ag (koz) |
Contained AgEq (koz) |
|
| Babicanora | Proven | 345 | 7.03 | 665 | 1,224 | 78 | 7,382 | 13,589 |
| Babicanora | Probable | 2,334 | 3.90 | 370 | 679 | 292 | 27,734 | 50,987 |
| Las Chispas | Proven | - | - | - | - | - | - | - |
| Las Chispas | Probable | 401 | 3.09 | 399 | 645 | 40 | 5,152 | 8,323 |
| Babicanora + Las Chispas |
Proven + Probable |
3,081 | 4.14 | 407 | 736 | 410 | 40,269 | 72,899 |
| Historical Stockpile | Proven | 150 | 1.14 | 112 | 203 | 6 | 541 | 980 |
| ROM Stockpile | Proven | 168 | 5.56 | 428 | 869 | 30 | 2,311 | 4,699 |
| Total Stockpile | Proven | 318 | 3.47 | 279 | 555 | 36 | 2,852 | 5,679 |
| Total Mineral Reserve Estimate | Proven + Probable | 3,399 | 4.08 | 395 | 719 | 446 | 43,121 | 78,579 |
Notes:
- The effective date of the estimate is June 30, 2022.
- The Mineral Reserve is estimated using the 2019 CIM Estimation of Mineral Resources & Mineral Reserves Best Practice Guidelines and 2014 CIM Definition Standards for Mineral Resources & Mineral Reserves.
- The Mineral Reserve is estimated with a 372 gpt AgEq fully loaded COG for the deposit and an 85 gpt AgEq Marginal COG for development.
- The Mineral Reserve is estimated using long-term prices of $1,650/oz for gold and $21.00/oz for silver.
- A government gold royalty of 0.5% is included in the Mineral Reserve estimates.
- Stockpile values were provided by SilverCrest and account for approximately 7% of mineral reserve ounces.
- The Mineral Reserve is estimated with a maximum mining recovery of 95%, with reductions in select areas based on geotechnical guidelines.
- The Mineral Reserve presented includes both internal and external dilution. The external dilution includes a mining dilution of 0.5 m width on both the hanging wall and footwall for the long hole mining method (1 m total), and a 0.2 m width on both the hanging wall and footwall for the resue mining methods (0.4 m total). Cut-and-fill mining was assumed as breasting in all cases, using the ore sill drive width of 3.3 m as a minimum mining width inclusive of dilution. Additional external dilution was applied in select areas based on geotechnical recommendations. Backfill dilution is also included and represents 4% for the long hole mining method and 7% for cut-and-fill and resue mining methods.
- A minimum mining width of 1.5 m, 3.3 m and 0.5 m was used for the long-hole, cut-and-fill and resue mining methods, respectively.
- Average metallurgical recoveries applied are 97.9% Au and 96.7% Ag.
- The economic viability of the Mineral Reserve has been demonstrated.
- AgEq(gpt) = (Au(gpt) * 79.51 + Ag(gpt)). AgEq calculations consider metal prices, metallurgical recoveries, Mexican Government gold royalty and tax rate.
- Estimates use metric units (metres (m), tonnes (t), and gpt). Metal contents are presented in troy ounces (metric tonne x grade / 31.103475).
- The independent Qualified Person is not aware of any known environmental, permitting, legal, title-related, taxation, socio-political or marketing issues, or any other relevant issue that could materially affect the Mineral Reserve Estimate.
- Totals may not add due to rounding.
The Mineral Reserve has a 48 kt increase and a 12.3 Moz AgEq (13%) decrease between the 2021 FS and 2023 Mineral Reserve Estimates as shown in Table 4. It should be noted that when comparing Mineral Reserve Estimates to the 2021 FS, the reduction in AgEq oz incorporates the updated gold to silver ratio change (-3.8M AgEq ozs) as noted in Table 4. Also, the reduction incorporates; updated resource modelling for narrower and more widely dispersed veins than originally modelled, an increase in cut-off grades due to increased industry costs, revised geotechnical standards, and mining method changes. Despite the reduction in ounces, the operational data allows for increased confidence on a go-forward basis.
Table 4 – Mineral Reserve Variance
| Mineral Reserve Estimate (Proven + Probable) | Tonnes (k) |
Au (gpt) |
Ag (gpt) |
AgEq (gpt) |
Contained Au (koz) |
Contained Ag (koz) |
Contained AgEq (koz) |
| 2021 FS at 86.9 AgEq | 3,351 | 4.81 | 461 | 879 | 518 | 49,679 | 94,704 |
| 2021 FS at 79.51 AgEq | 3,351 | 4.81 | 461 | 843 | 518 | 49,679 | 90,875 |
| 2023 TR (June 30, 2022) | 3,399 | 4.08 | 395 | 719 | 446 | 43,121 | 78,579 |
| Difference | 48 | (0.73) | (66) | (124) | (72) | (6,558) | (12,296) |
Note: The 2021 FS is no longer current and the 2021 FS results are no longer supported by the results of the 2023 Mineral Reserve Estimates in the Report and should not be relied upon.
The processed and depleted ore, from July 1, 2022 to December 31, 2022 was deducted from the Mineral Reserve in the LOM financial model.
Reconciliation
The Company implemented a Mineral Reserve to plant global reconciliation program when the plant began operations in June 2022. The Updated Reserve Estimate was compared to actual plant production from June 2022 to April 2023 which reconciled to within 5% of the 6.8 Moz AgEq ounces processed. The reconciliation results indicate the Mineral Reserve Estimate is well represented and is within an acceptable range for a narrow and high-grade vein deposit. Using this 10-month period from the effective date of the Mineral Reserve Estimate to test the assumptions in the model alongside actual mine and plant production has further de-risked Las Chispas.
Underground Mine
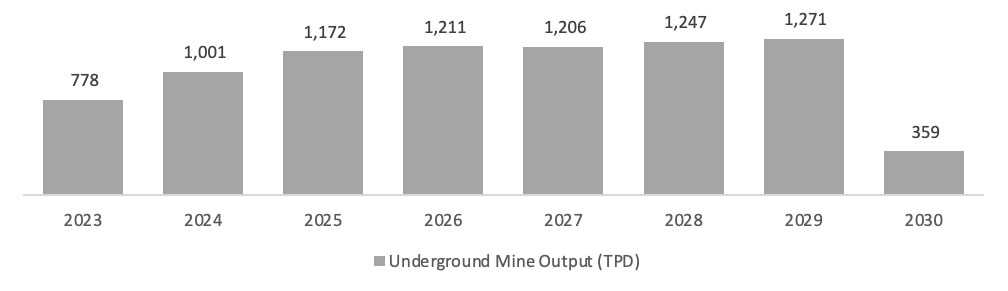
The Report outlines a ramp-up as per Figure 1. For 2023, the Report estimates an average underground mine production of 778 tpd, in line with current operational performance and expectations. The mining rate will start increasing in Q1, 2024 and is expected to average approximately 1,000 tpd throughout 2024. Starting in 2026, the mining rate is expected to reach above 1,200 tpd. This rate is expected to be maintained through to 2029. This new design allows for a more conservative use of the surface stockpiles that supplement ore mined from the underground. The balance of the Las Chispas current Mineral Reserve is expected to be exhausted in 2030, during which time mining rates are expected to reduce considerably as production areas are depleted.
Figure 1 – LOM Mining Rates
Learning from 18 months of ramp up production has helped to simplify the mine plan to a safer and more sustainable operation by reducing cut & fill and resue mining methods and relying more on the long-hole mining method as shown in Figure 2.
Figure 2 – Change in Percentage of Mining Methods
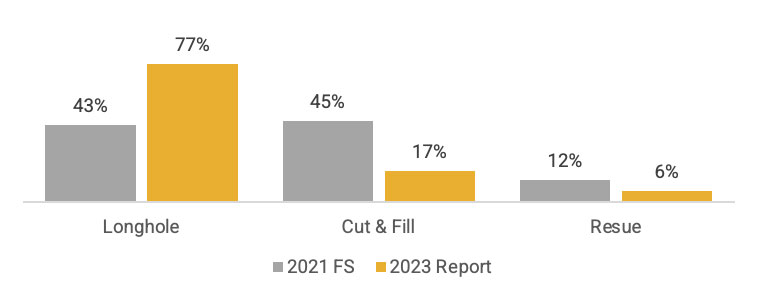
As previously disclosed in November 2022, SilverCrest’s current operational plan reduced the use of the resue mining method. This method was originally incorporated to limit dilution, however, safety and productivity issues resulted in diminished operational and economic performance. The new LOM significantly reduces the use of resue mining and will be primarily replaced by the lower cost and more productive long-hole mining method. The trade-off is increased dilution which can be seen by the lower head grade. The balance of stoping production will use the cut and fill mining method in areas of poor ground conditions.
The impact of the new LOM is a less complex operation with fewer working faces, less equipment and labour, increased productivity and a reduction in per tonne mining costs. The trade-off is more dilution and a related reduction in head grade.
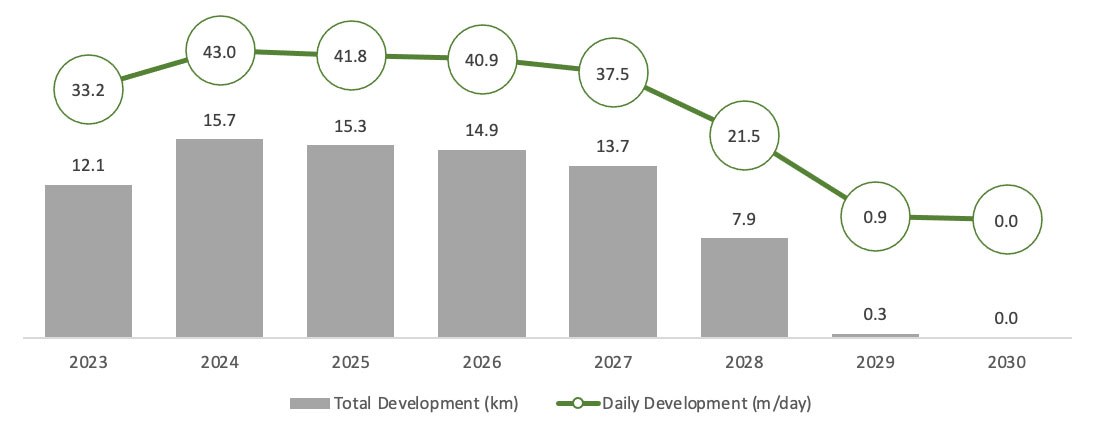
The mining schedule incorporates development rates of 34 m/day in H2, 2023, a level that is similar to Q2, 2023 performance. In 2024, the development rate is expected to increase to approximately 43 m/day. This increased development rate will be possible with the recent establishment of a third portal at the Las Chispas Area.
Figure 3 – Lateral Development Rate
Process Plant
The Las Chispas process plant has been designed to achieve nominal throughput of 1,250 tpd. The operating results to date indicate that this throughput rate can be achieved with better than initially expected metallurgical recoveries. The Report includes updated and improved recoveries of 98.0% Au and 97.0% Ag over the LOM. The simplified plant process diagram has now stopped the use of the flotation circuit which was determined to be unnecessary to achieve the improved recoveries. The process plant performance to date has also provided confidence that it can efficiently operate with a wide range of grade and clay content. The process plant is expected to operate at an average throughput of 1,200 tpd from 2023 – 2029.
Figure 4– Process Plant Throughput and Stockpile Balance at End of Period
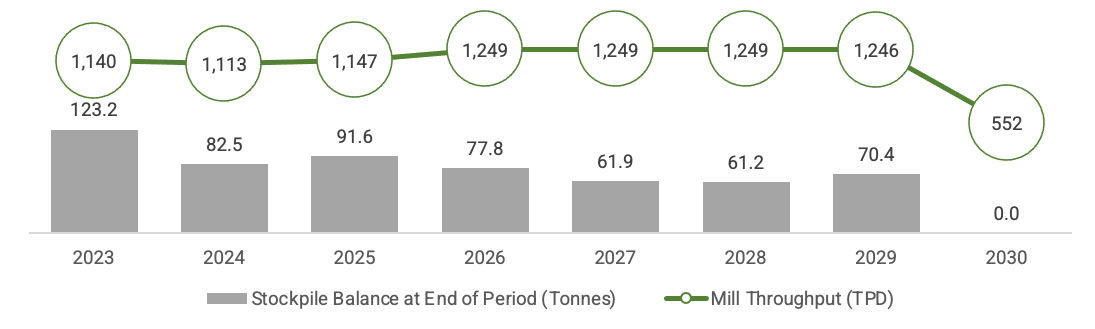
Table 5 – AgEq Mill Head Grade (gpt)
| 2023 | 2024 | 2025 | 2026 | 2027 | 2028 | 2029 | 2030 |
| 761.1 | 750.6 | 734.8 | 708.5 | 649.4 | 706.1 | 766.6 | 591.5 |
Note: Exclusive of ounces sold from inventory.
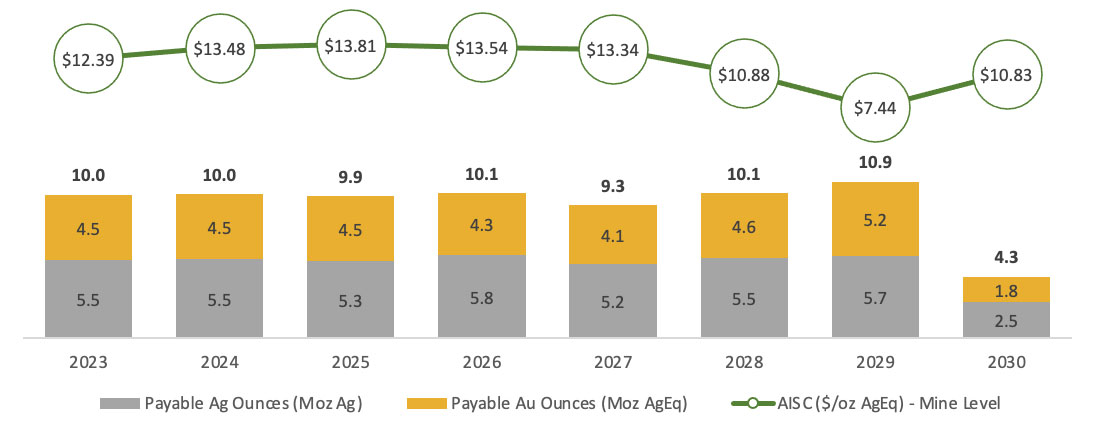
Production Profile
The production profile for the LOM is shown below. The LOM schedule has focused first on the foundation provided by a progressive mine ramp-up supported by proven development rates. The stable metal production through the LOM benefits from the flexibility provided by the early mine development and by the reliance on the surface stockpile. The surface stockpile has proven to be a great advantage to stabilize plant feed grade and production and this flexibility is being maintained under the updated production plan. The new production plan allows SilverCrest to maintain surface stockpiles through the LOM. It is now expected that surface stockpiles will provide approximately two months of process plant feed throughout the LOM, which could be processed earlier than scheduled if the mining ramp-up performs better than proposed in the Report or provide process plant feed in the event of a mine production shortfall.
Figure 5 – Production Profile
Sustaining Capital Costs
Life of mine sustaining costs are estimated to be $219.9M with 93% of these costs relating to underground mining and infrastructure. This is a 77.5% increase in cost estimated in the 2021 FS. Total sustaining development over the LOM is expected to be 50.3 km which represents the core of the sustaining capital for the underground mine ($175.5M). The cost of underground sustaining development has increased due to a combination of higher development unit rates and additional infrastructure for an expanded mine. The underground infrastructure totals an estimated $28.3M. The balance of the sustaining capital totals $16.2M and covers the needs for the surface requirements including the process plant, the tailings facility and the surface infrastructures.
It is expected that sustaining capital costs will be more elevated in H2, 2023 than in H1, 2023 as a result of development of underground ventilation infrastructure and the establishment of underground mobile maintenance facilities. The 2024 sustaining capital will increase from 2023 levels as underground development is increased.
Figure 6 – Sustaining Capital Cost Profile
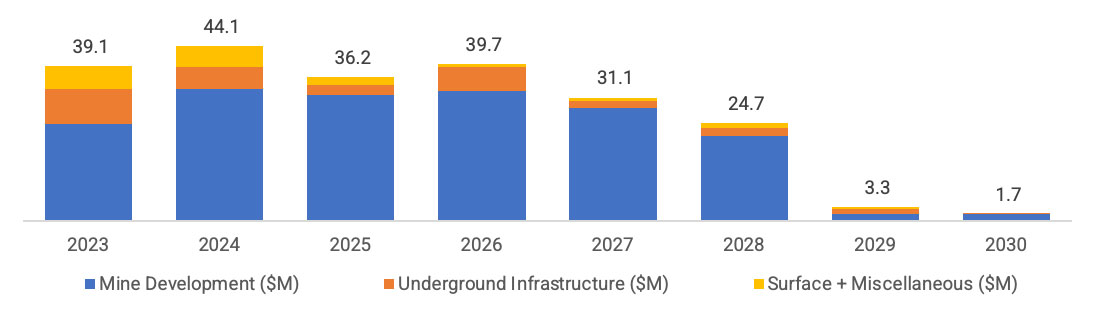
Closure costs of $6.8M which are expected to be incurred during the period of 2030 to 2032 are not included in Figure 6.
Operating and All-in-Sustaining Costs
Costs for the Las Chispas Operation were updated to reflect the revised cost structure, largely based on a Q1, 2023 basis. As highlighted prior to the release of the Report, a number of areas of the operation have experienced substantial cost inflation with manpower and consumables experiencing the most significant impacts.
Underground mining costs also reflect the change to long-hole mining as the predominant mining method as well as the utilization of more strict ground control standards and expansion of the footprint of the mine which requires additional operating development metres, equipment and additional and more expensive staff and labor. Both cut and fill and resue methods require breasting development which also contributes to higher operating costs.
Process cost increases can be attributed firstly to an increase in maintenance supplies, consumables and to an increase in the number of manpower and wages of this manpower. It is important to note that some of the consumables’ increases can be linked to the increase in gold and silver recovery from the plant.
Site general and administrative cost has been updated to reflect increased manpower, and increased wages of this manpower. It also reflect the use of the camp through the LOM.
Mining contract discussions were paused in Q2, 2023 and will resume in earnest now that necessary details outlined in the Report are available. It is expected that these negotiations will be finalized in H2, 2023. Costs beginning in 2024 include an allocation for potential cost increased related to these negotiations.
Table 6 – Operating Costs
| Item | $/t |
| Mining Cost ($/t mined) | 108 |
| Process Cost ($/t processed) | 47 |
| G&A Cost ($/t processed) | 21 |
| Total Operating Cost ($/t processed) | 168 |
Table 7 – Mine Level AISC Breakdown
| Item | $M | $ Per Payable AgEq oz | % of AISC |
| Mining | 325.4 | 4.37 | 36% |
| Processing + TCRC | 178.6 | 2.40 | 20% |
| G&A | 69.9 | 0.94 | 8% |
| Inventory Adjustments | 10.3 | 0.14 | 1% |
| Cash Costs | 584.2 | 7.84 | 65% |
| Sustaining Capital | 219.9 | 2.95 | 25% |
| Closure(1) | 6.8 | 0.09 | 1% |
| Government Royalties | 82.0 | 1.10 | 9% |
| AISC | 892.9 | 11.98 | 100% |
Note:
- Closure costs from 2030 to 2032
Las Chispas Operation Economics
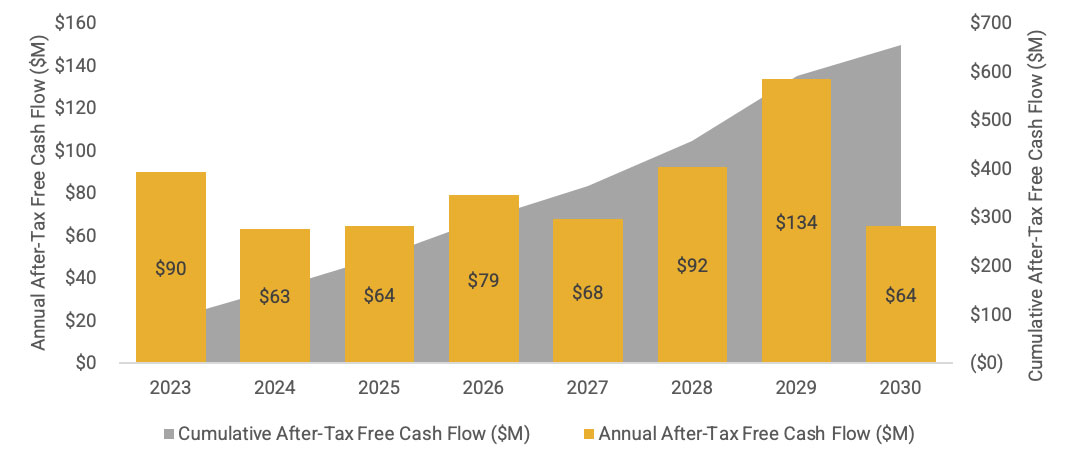
Considering three-year trailing prices of $1,800/oz Au and $23.00/oz Ag as the Base Case, Las Chispas is expected to generate average annual after-tax free cash flow of $84M from 2023-2029. At spot prices as of July 26, 2023 of $1,963/oz Au and $24.92/oz Ag the average annual after-tax free cash flow is estimated to be $97M over the same time period.
As of January 1, 2023, SilverCrest had $71M of net operating losses available which helped reduce taxes payable throughout 2023. It is estimated, at the Base Case, that these operating losses will be fully utilized by the end of 2023 and as a result, contribute to the reduction in after-tax free cash flow in 2024.
Figure 7 – LOM Free Cash Flow (FCF)
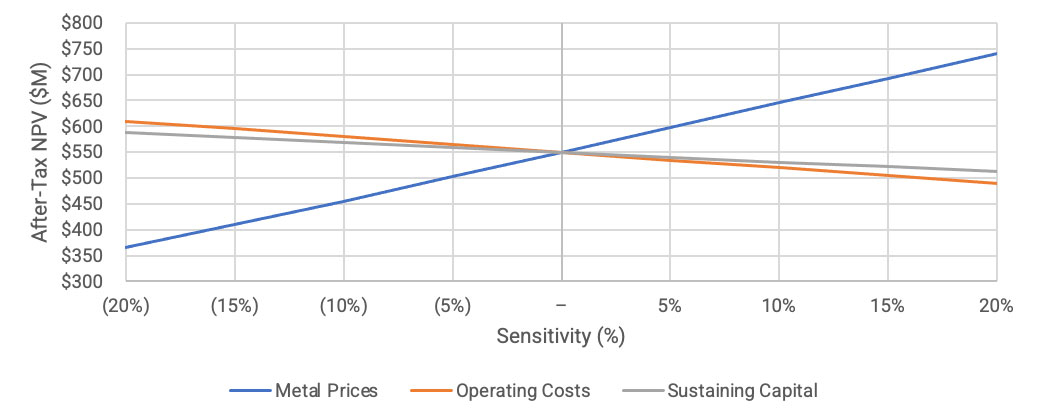
The Las Chispas Operation is most sensitive to metal prices; however, the cash flow profile would not be substantially impacted by a decrease in this metric.
Figure 8 – After-Tax NPV Sensitivities
The LOM mine level AISC margin is not significantly impacted by a change in metal prices. At Base Case metal prices, the mine level AISC margin is 48%. Table 8 below shows the impact on mine level AISC margin for every 5% change in metal prices.
Table 8 – Mine Level AISC Sensitivity to Metal Prices
| Metal Price Sensitivity % | Mine Level AISC Margin % |
| (20) | 36 |
| (15) | 40 |
| (10) | 43 |
| (5) | 45 |
| – | 48 |
| 5 | 50 |
| 10 | 52 |
| 15 | 53 |
| 20 | 55 |
Opportunities
The most significant source of upside for Las Chispas remains the potential conversion of Indicated and Inferred Mineral Resources to Mineral Reserves and discovery of additional mineralization that may support future potential mine life growth.
There is an estimated 24.1 Moz AgEq (1.3 Mt grading 3.73 gpt Au and 269 gpt Ag, or 566 gpt AgEq) of Inferred Mineral Resources defined in the Report. The majority of Inferred Mineral Resources are located in the Babicanora Sur, Babicanora Main and FW, El Muerto Splay and the Babicanora Norte Vein NW Extension. Focusing on higher probability conversion opportunities, there is an estimated 15.0 Moz AgEq, including 10.0 Moz AgEq of which can be immediately drilled as an opportunity for potential higher grade Mineral Reserve replacement proximal to planned mining areas for increased mine life or plant throughput. Exploration of several underexplored targets on site is already underway. The additional higher grade Inferred Mineral Resources will be targeted once additional underground development has been completed.
There is also an estimated 23.3 Moz AgEq of Indicated Mineral Resources that were not included in the Mineral Reserve or production profile. There is potential for a portion of these ounces to be included with further drilling and engineering studies.
Surface exploration has identified over 23 km of potential vein strike length that remain underexplored, not including targets at depth. Future drilling will focus on step-out drilling within the known mineralization zones and testing deeper host lithologies, parallel veins and newly identified areas. There also remain several blind veins with greater than 100 drill intercepts grading more than 500 gpt AgEq that require further exploration attention.
In addition to exploration opportunities, continued testing of long-hole stoping design (amongst others, AVOCA) will evaluate the potential to reduce dilution and include marginal ounces that were not converted in the stope design and selection process. There may also be an opportunity to add ounces by re-assessing the geotechnical standards on pillar dimensions through the collection of additional geotechnical data. Other opportunities include further optimization of the mine design to reduce the required development metres and associated costs, and also potential to increase process plant throughput if the mine ramp-up accelerates beyond the current proposed levels.
About the updated Technical report
The Report, including an updated Mineral Resource Estimate and an updated Mineral Reserve Estimate, will be filed under the Company’s SEDAR+ profile within 45 days of this news release.
Ausenco managed the Report with several other engineering companies and consultants contributing to sections of the Report. The firms and consultants who are providing Qualified Persons responsible for the content of the Report are, in alphabetical order, Ausenco Engineering Canada Inc., BBE Group Canada, Entech Mining Ltd., Hydro-Resources Inc., Knight Piesold Ltd., P&E Mining Consultants Inc., WSP Canada Inc., and WSP/Wood Mine Services. The following independent Qualified Persons with associated firms have reviewed and approved this news release as defined by National Instrument 43-101 – Standards of Disclosure for Mineral Projects (“NI 43-101"):
- Kevin Murray, P. Eng, Ausenco
- Patrick Langlais, P.Eng, Entech Mining Ltd.
- Eugene J. Puritch, P.Eng., FEC, CET, P&E
- Benjamin Peacock, P.Eng., Knight Piesold
- Michael Verreault, P.Eng., M.Sc.A., Hydro-Ressources Inc
- Wynand Marx, BBE Group Canada
- Christopher Lee, P.Eng. WSP Canada Inc.
- Humberto Preciado, PhD, PE, WSP/Wood Mine Services
This news release has also been reviewed and verified by N. Eric Fier, CPG, P.Eng, CEO of SilverCrest and a Qualified Person as defined by National Instrument 43-101 – Standards of Disclosure for Mineral Projects (“NI 43-101”).
Conference Call
A conference call to discuss the results of the Report will be held Tuesday, August 1, 2023 at 8:30 a.m. ET / 5:30 a.m. PT. To participate in the conference call, please dial the numbers below.
Date & Time: Tuesday, August 1, 2023 at 8:30 a.m. ET / 5:30 a.m. PT
Telephone: Toronto: +1-416-764-8624
North America Toll Free: 1-888-259-6580
Conference ID: 01537394
Webcast: https://silvercrestmetals.com/investors/presentations/
ABOUT SILVERCREST METALS INC.
SilverCrest is a Canadian precious metals producer headquartered in Vancouver, BC, with an ongoing initiative to increase its asset base by expanding current Mineral Resources and Mineral Reserves, acquiring, discovering and developing high value precious metals projects and ultimately operating multiple silver-gold mines in the Americas. The Company’s principal focus is operating its Las Chispas Operation in Sonora, Mexico. The Company is led by a proven management team in all aspects of the precious metal mining sector, including taking projects through discovery, finance, on time and on budget construction, and production.
FORWARD-LOOKING STATEMENTS
This news release contains “forward-looking statements” and “forward-looking information” (collectively “forward-looking statements”) within the meaning of applicable Canadian and United States securities legislation. These include, without limitation, statements with respect to: the timing and amount of expected production from the Las Chispas Operation; the estimation of mine life, mining rates, Mineral Reserves and Mineral Resources, the metallurgical recovery rates, grade, production rate, the costs, and the cash flow generation; and the strategic plans, timing and expectations for the Company's current and future development and exploration plans, including but not limited to the planned target areas and the potential to convert any portion of the Inferred Mineral Resource to economically viable Mineral Reserves. Such forward-looking statements or information are based on a number of assumptions, which may prove to be incorrect. Assumptions have been made regarding, among other things: present and future business strategies, continued commercial operations at Las Chispas, the environment in which the Company will operate in the future, including the price of gold and silver, estimates of capital and operating costs, production estimates, estimates of Mineral Resources and Mineral Reserves and metallurgical recoveries and mining operational risk; the reliability of Mineral Resource and Mineral Reserve Estimates, mining and development costs, the conditions in general economic and financial markets; availability of skilled labour; timing and amount of expenditures related to exploration programs; and effects of regulation by governmental agencies and changes in Mexican mining legislation. The actual results could differ materially from those anticipated in these forward-looking statements as a result of risk factors including: the timing and content of work programs; results of exploration activities; the interpretation of drilling results and other geological data; receipt, maintenance and security of permits and mineral property titles; environmental and other regulatory risks; project cost overruns or unanticipated costs and expenses; fluctuations in gold and silver prices and general market and industry conditions. Forward-looking statements are based on the expectations and opinions of the Company’s management on the date the statements are made. The assumptions used in the preparation of such statements, although considered reasonable at the time of preparation, may prove to be imprecise and, as such, readers are cautioned not to place undue reliance on these forward-looking statements, which speak only as of the date the statements were made. The Company undertakes no obligation to update or revise any forward-looking statements included in this news release if these beliefs, estimates and opinions or other circumstances should change, except as otherwise required by applicable law.
CAUTIONARY NOTE TO US INVESTORS
This news release includes Mineral Resource and Mineral Reserve classification terms that comply with reporting standards in Canada and the Mineral Resource and Mineral Reserve Estimates are made in accordance with NI 43-101. NI 43-101 is a rule developed by the Canadian Securities Administrators that establishes standards for all public disclosure an issuer makes of scientific and technical information concerning mineral projects. These standards differ from the requirements of the United States Securities and Exchange Commission (the “SEC”) applicable to domestic United States reporting companies. Consequently, Mineral Resource and Mineral Reserve information included in this news release may not be comparable to similar information that would generally be disclosed by United States domestic reporting companies subject to the reporting and disclosure requirements of the SEC. Accordingly, information concerning mineral deposits set forth herein may not be comparable with information made public by companies that report in accordance with US standards.
NON-IFRS MEASURES
SilverCrest uses certain performance measures that are not defined under International Financial Reporting Standards ("IFRS") in this news release. Non-IFRS measures do not have any standardized meaning under IFRS and may not be comparable to similar measures presented by other issuers. The Company believes that, in addition to conventional measures prepared in accordance with IFRS, management and certain investors use this information to evaluate the Company's performance and ability to generate cash flow. Accordingly, it is intended to provide additional information and should not be considered in isolation or as a substitute for measures of performance prepared in accordance with IFRS. For further information on explanations and reconciliations of Non-IFRS measures for cash costs, AISC and net free cash flow, refer to the Non-IFRS Measures section of the Company’s Management’s Discussion & Analysis ("MD&A") for the three months ending March 31, 2023, dated May 11, 2023, beginning on page 14.
Cash costs and cash costs per silver equivalent ounce payable
The Company uses cash costs per silver equivalent ounce payable to monitor its operating performance internally. The most directly comparable measure prepared in accordance with IFRS is cost of sales. The Company believes this Non-IFRS financial measure provides investors and analysts with useful information about its underlying cash costs of operations. In comparison to Non-IFRS financial measure disclosure in the Company' MD&A, cash cost per ounce in this news release is based on AgEq oz payable, as opposed to AgEq oz sold.
AISC and AISC per silver equivalent ounce payable
This Non-IFRS financial measure aims to assist readers in evaluating the total cost of producing silver from its operation. The most directly comparable measure prepared in accordance with IFRS is cost of sales. In comparison to Non-IFRS financial measure disclosure in the Company' MD&A, AISC/oz in this news release is based on AgEq oz payable, as opposed to AgEq oz sold. In addition, for the purpose of this news release, AISC excludes but not limited to corporate general and administrative expenses, exploration expenses and share-based payments.
Net free cash flow
Net free cash flow is not meant to be a substitute for the cash flow information presented in accordance with IFRS. The Company believes that this measure provides valuable assistance to investors and analysts in evaluating the Company’s ability to generate cash flow after capital investments and build the cash resources of the Company. The most directly comparable measure prepared in accordance with IFRS is net cash provided by operating activities less net cash used in investing activities.
Treasury assets
SilverCrest calculates treasury assets as cash and cash equivalents plus bullion as reported in the consolidated statements of financial position. The Company believes that in addition to conventional measures prepared in accordance with IFRS, treasury assets is useful to evaluate the Company’s liquidity and capital resources.
N. Eric Fier, CPG, P.Eng
Chief Executive Officer
SilverCrest Metals Inc.
For Further Information:
SilverCrest Metals Inc.
Contact: Lindsay Bahadir, Manager Investor Relations and Corporate Communications
Telephone: +1 (604) 694-1730
Fax: +1 (604) 357-1313
Toll Free: 1-866-691-1730 (Canada & USA)
Email: [email protected]
Website: www.silvercrestmetals.com
570 Granville Street, Suite 501
Vancouver, British Columbia V6C 3P1
Email Sign Up